HI Paul,
Some of use were chatting recently and there are servers out there with 2TB of RAM.
128GB of RAM is by no means big.
However, saying this, if I were IT I probably would have asked you if you have optimised usage as far as you can.
Have you looked at what usage the cubes show using Performance Monitor and }StatsbyCube?
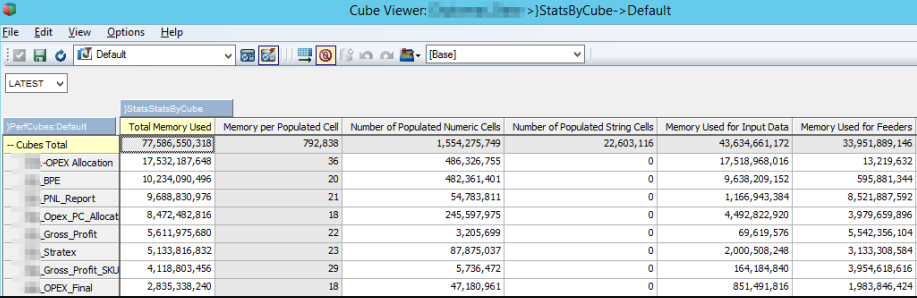
- MemoryUsage.png (109.38 KiB) Viewed 5328 times
Add a new numeric member called: Memory per Populated Cell and then the rule below.
Code: Select all
['Memory per Populated Cell']=N:
['Memory Used for Input Data'] \
( ['Number of Populated Numeric Cells'] +
['Number of Populated String Cells'] );
I then sort my cubes from highest to lowest on Total Memory Used and then look at the value in the Memory per Populated Cell.
Typically anything over 40 may be a concern but there are many factors that can increase the value so some consideration needs to be given to the following:
- Number of dimensions. The "address" of each cell gets longer with each dimension added to the cube. The pointer to each member in each dimension will require a few bytes and the sum of these adds up.
- Number of members in a dimension. As a dimension gets larger the pointer to each member will get more complex and thus require more bytes.
- String data in the cube will skew the values as string require more memory to store the data for each string related cell.
Hubert's video on
How TM1 actually works should give some more insights into my rough understanding of the above.
Once you have identified a candidate consuming what looks like too much memory per cell, you could then look at reordering the dimensions.
There are various articles here on this topic but armed with some of what Hubert has shared, knowledge of how your model works, is populated in terms of small to big dimensions and sparse to dense, you should be more informed to try and reduce memory consumption.
If you think manual reordering will be pure guesswork, Marius Wirtz has you covered with
OptimusPY. This will at least take some of the guesswork away from you by simulating some scenarios based on a provided cube view and process. The bonus is you get a view of not only the new memory/savings but the performance too. No point saving a gig or two and have queries take double the time.
The other thing you could look at is the memory consumed by feeders as you may have overfeeding.
There is a debug utility which can dump a bunch of information including information on your feeders.
This is undocumented etc. so caution etc. and use in Dev only.
Code: Select all
DebugUtility( 123, 0, 1, pPath|'\Model_Information.txt', '', '' );
The 0 after the 123, includes (0) or suppresses (1) control objects.
The 1 after the 0, is the flag to include the extra feeder information.
Hope this helps from a validation of existing resources point of view to give you some evidence if required.